
Dig Deeper: Affordable Housing Needs in Your Community

PolicyMap is proud to announce our partnership with the NYU Furman Center, a joint center of the New York University School of Law and the Robert F. Wagner Graduate School of Public Service advancing research and debate on housing, neighborhoods, and urban policy.
The NYU Furman Center’s Local Housing Solutions is a one-stop housing policy platform with actionable resources and step-by-step guidance to help cities develop, implement, and monitor local housing strategies. Its resources are designed to be easily accessible and actionable to users at all experience and capacity levels throughout the United States.
Together, we have created a publicly available Housing Needs Assessment tool that enables policymakers, practitioners and community leaders to build local housing strategies driven by relevant data and insights.
Housing Needs Assessment
Before a policymaker, practitioner, or community leader can start building a housing strategy, it is imperative to understand local housing needs. With compelling and interactive visualizations, the Housing Needs Assessment provides you with the information you need to interpret and integrate this data into a comprehensive housing strategy. The tool compiles and visually displays publicly available national data sources, such as the US Census, American Community Survey (ACS), and the US Department of Housing and Urban Development (HUD). The result is digestible city- or county-level data indicators of local housing need — no specialized data knowledge necessary.
The Housing Needs Assessment displays and provides context on key data for a locality’s:
- Demographics
- Rental Affordability
- Homeownership Affordability
- Dedicated Affordable Housing
- Adequacy of Housing Production
- Housing Stock Characteristics
- Neighborhood Variations
- Housing Stock for Older Adults
1. Demographics
Examining the demographics of a locality is key to understanding and addressing the housing needs of your community. Under Demographics, you will find:
- Total Population
- Population by Age, Race and Ethnicity
- Poverty Level and Trend
- Share of Population with a Disability
The example chart below for Cleveland, OH shows that the share of population with a disability is six percentage points higher than the state of Ohio and seven percentage points higher than the United States as a whole. This suggests that Cleveland may want to consider adapting housing for specialized needs, such as wider doorways or easy-entry showers.
Dig deeper to find publicly available demographic data from PolicyMap.
2. Rental Affordability
The Housing Needs Assessment offers a look at Rental Affordability for the selected jurisdiction by providing the following:
- Share of Households Who Rent
- Share of Renters by Age
- Share of Renter Households Moderately or Severely Cost Burdened
- Share of Renter Households that are Cost Burdened Across Income Ranges
- Distribution of Renter Households and Affordable Rental Units by Income
- Comparison of Rent and Income Changes Over Time
- Change in Stock of Rental Units Below $500 and $1,000 a Month
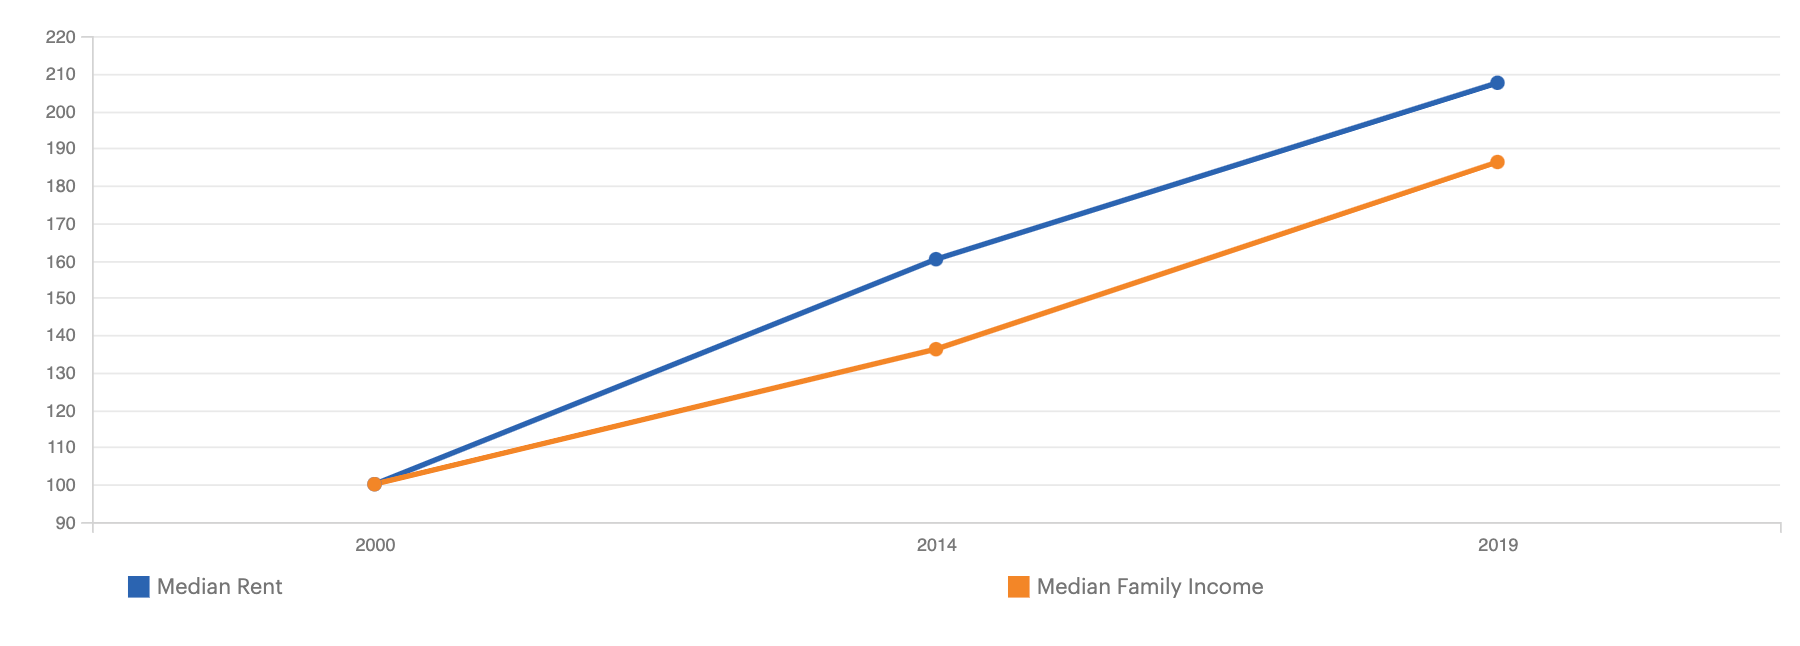
The example graphs below for Oakland, CA show that growth in median rent has slightly outpaced growth in median family income. That translated into a 36.6% reduction in the share of units with monthly rents under $1,000.
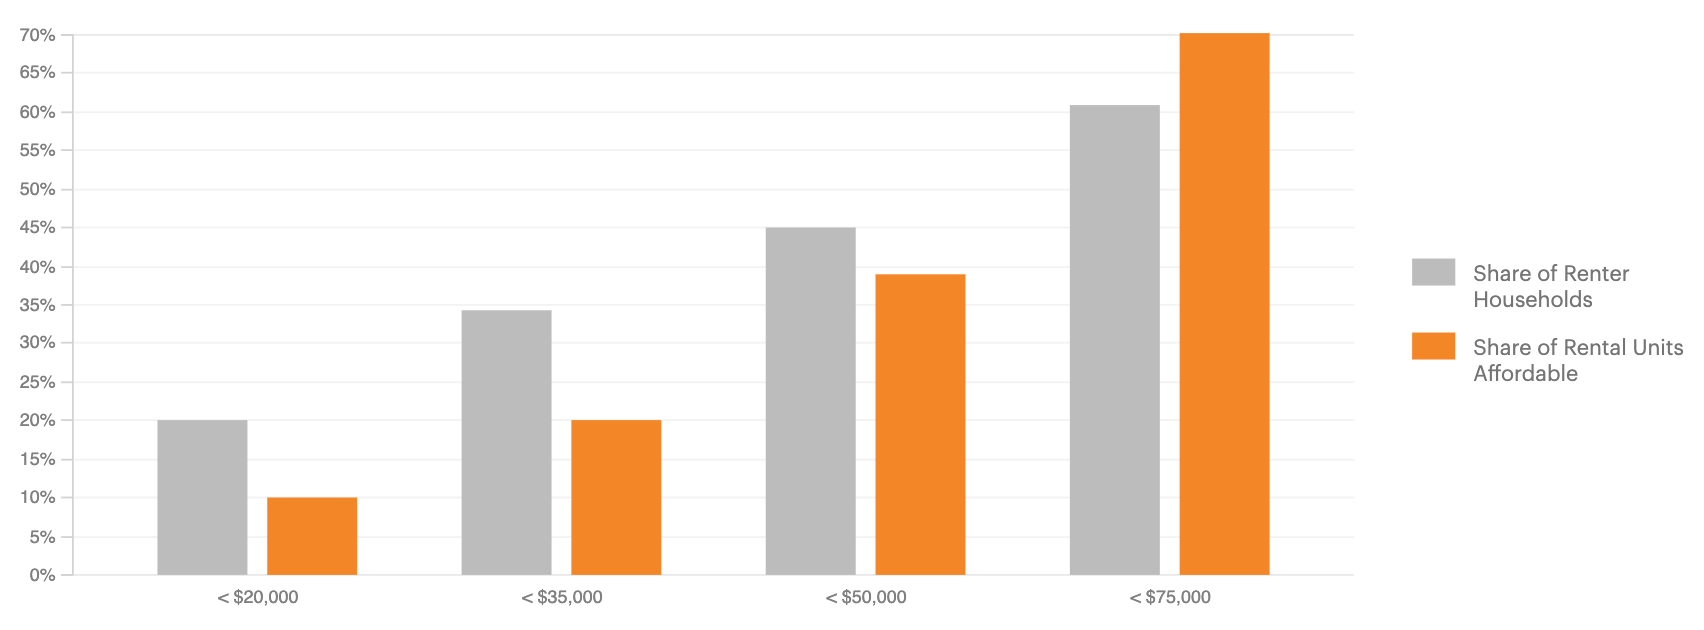
How does the change in rents affect affordability in Oakland? The share of affordable rental units appears less than the share of renter households at every income level except for households earning more than $75,000 per year.
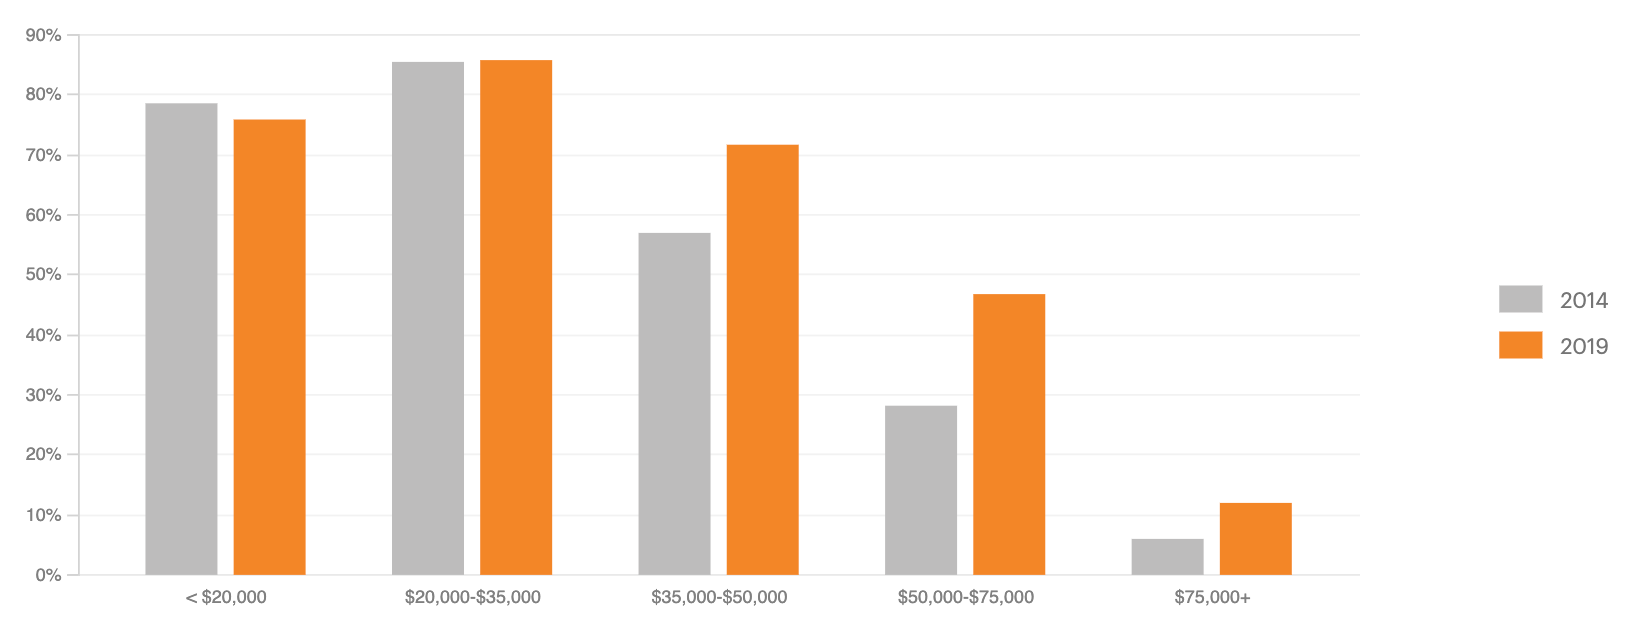
Across every income range except families making under $20,000 a year, Oakland has experienced an increase in the share of rent-burdened households.
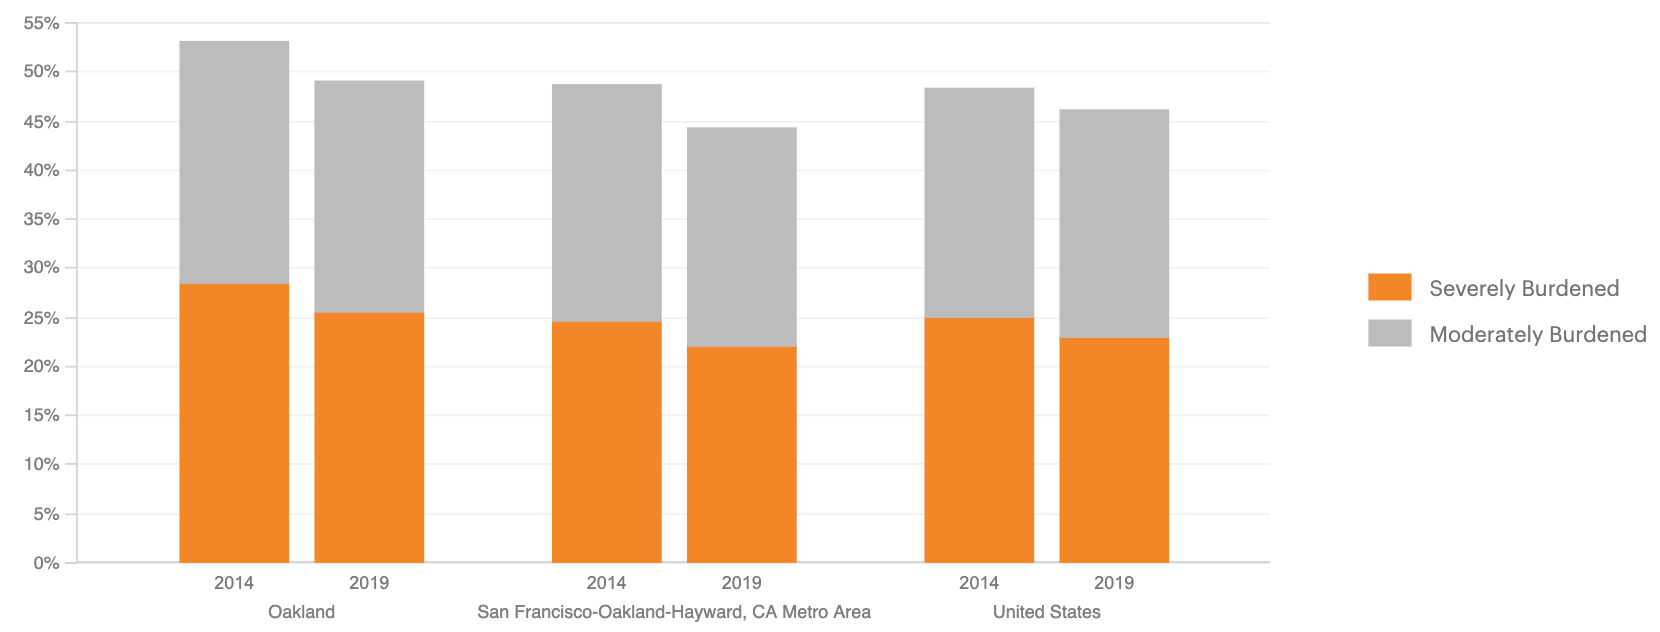
For context, examine the Moderately or Severely Cost Burdened Renter Households comparisons to the wider metro area or nationally. The share of moderately or severely cost-burdened renter households decreased in Oakland over the last five years. There are several potential explanations for the decline. One possibility is that a growing economy or minimum wage increases may have alleviated housing costs burdens as incomes grew faster then rents. Another scenario is that more affluent households are renting (possibly in connection with rising home prices), which would decrease the share of cost-burdened households without providing real relief to low-income households. Regardless of the cause, Oakland’s share of cost burdened households remains higher than its surrounding metro area and the total United States.
Learn how to use the tools on Local Housing Solutions to increase the affordability of rental housing.
3. Homeownership Affordability
- The Housing Needs Assessment offers a look at Homeownership Affordability for the selected jurisdiction by providing the following:
- Homeownership Rate, by Race, Ethnicity, and Age
- Changes Over Time in Median Home Values and Median Family Incomes
- Distribution of Reported Home Values
- Distribution of Homeowners with Mortgages by Income
- Share of Owner Households Moderately or Severely Cost Burdened
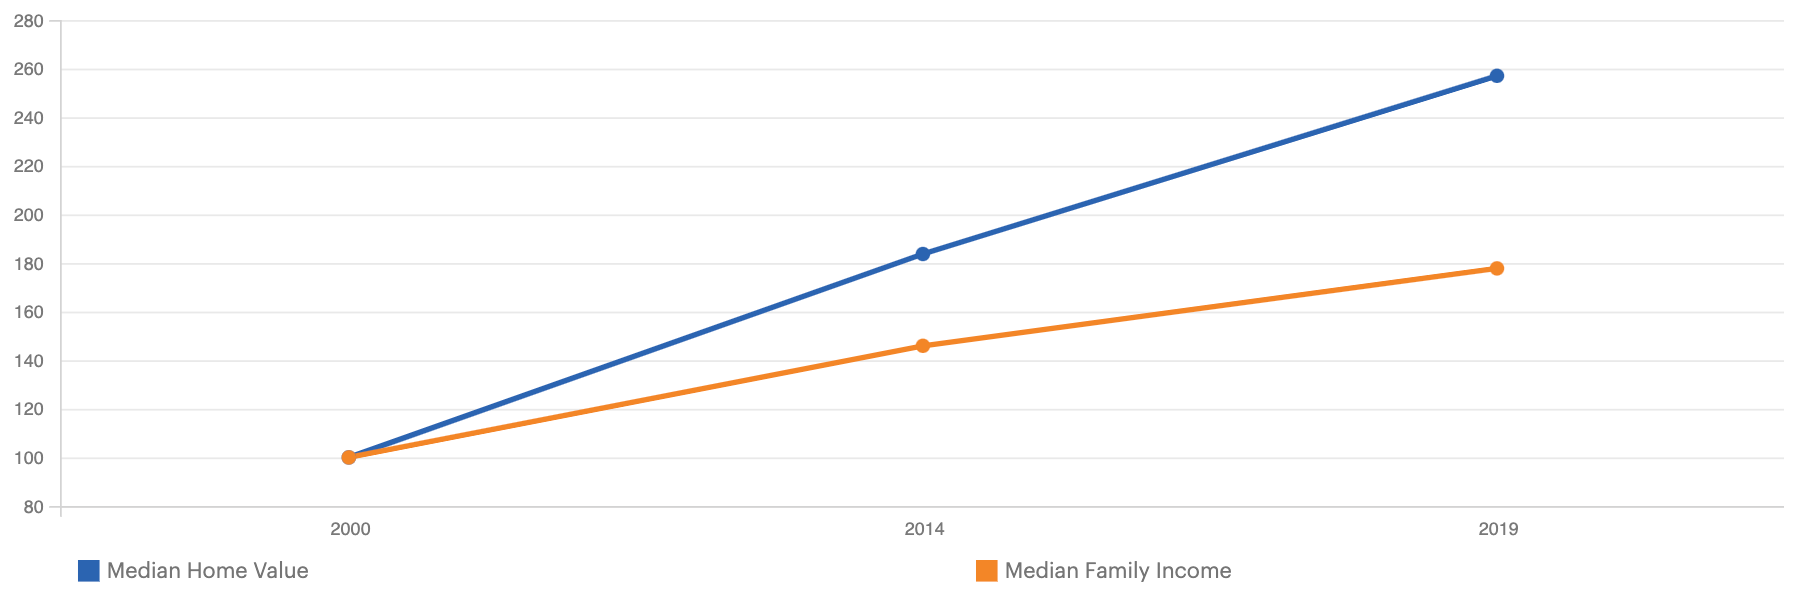
In Boulder, CO, the median home value increased 157% from 2000 to 2019 versus 78% for the median family income in the same period. While this trend of median home value growth outpacing median family income is observable across the United States, the gap has widened more rapidly in Boulder, compromising homeownership affordability.
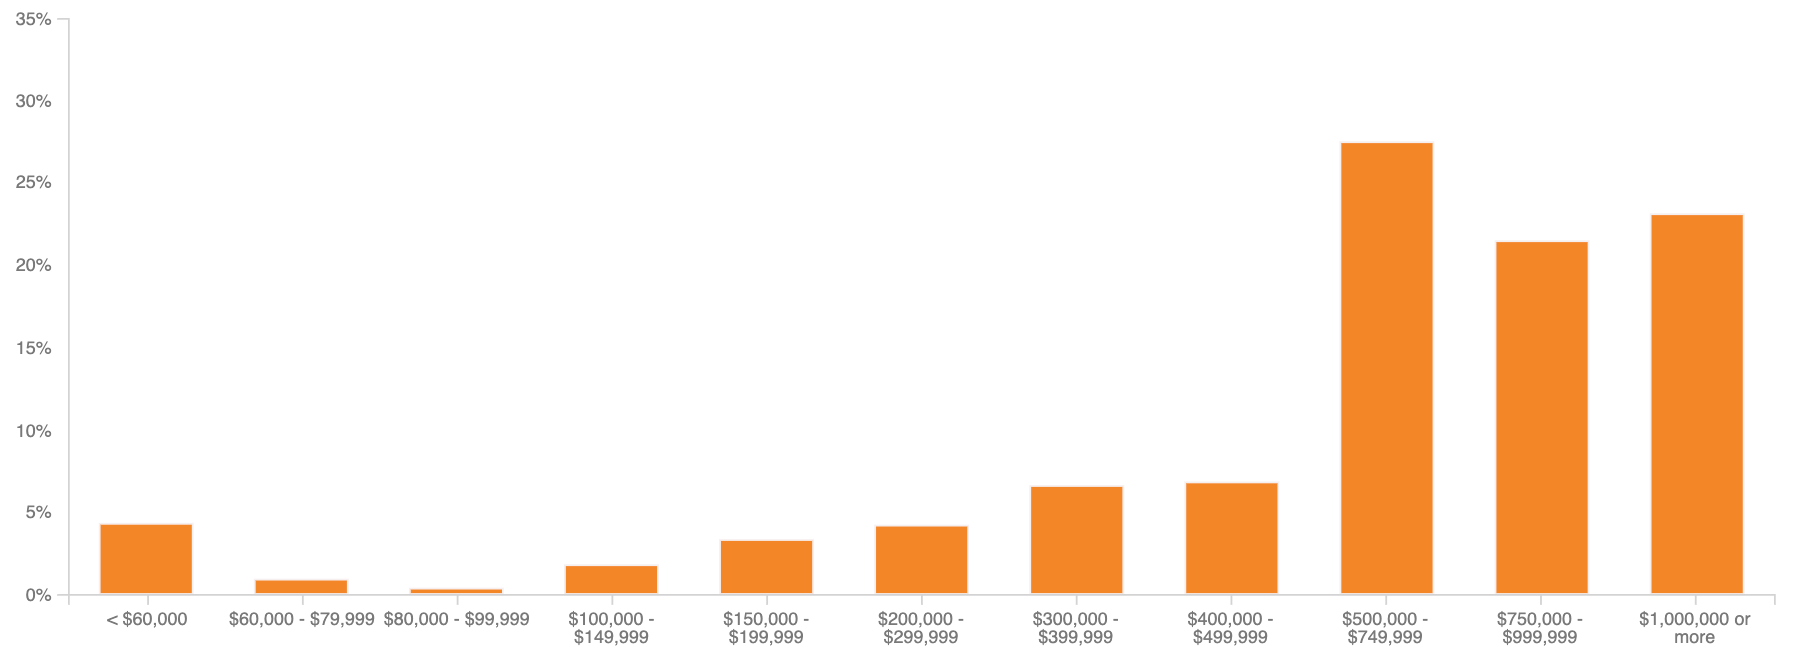
The distribution of reported home values indicates that values of owner-occupied homes in Boulder are concentrated at $400,000 or greater.
For more on homeownership affordability, see PolicyMap’s analysis using housing market trends.
4. Dedicated Affordable Housing
Dedicated affordable housing is housing that comes with binding rent and/or income restrictions targeted toward low- and moderate-income households. Dedicated affordable housing investments can be made equitably by considering a balance between “place-based” and “mobility” strategies to overcome patterns of segregation and foster inclusive communities.
Therefore, the Housing Needs Assessment offers:
- Number of Federally Subsidized Housing Units
- Locations of Federally Subsidized Properties
- Federally Subsidized Housing Units by Expiration
In Syracuse, NY, there are 6,793 federally subsidized housing units. The graph below breaks down the subsidized units by source of federal funding.
The accompanying interactive map pinpoints every affordable housing unit across Syracuse by property type. Clicking into the points brings up the site’s details such as address, construction type, number of units, and its funding status.
To study how the dedicated affordable housing stock can change in the next 10 years, the Housing Needs Assessment tool includes the count of federally subsidized housing units by expiration date. By 2025, affordability restrictions on 1,198 units of federally subsidized housing in Syracuse are set to expire. The units may stay affordable if owners elect to renew their units or if the area’s rental market is soft. However, expiring restrictions could raise rents substantially, reducing the stock of affordable rental units. Learn how to preserve the affordability of the existing stock of dedicated affordable rental housing.
5. Adequacy of Housing Production
Increasing the overall supply of housing so that it keeps pace with rising demand is an important strategy for promoting affordability. The Housing Needs Assessment offers the following data points to understand a jurisdiction’s housing production:
- Relative Growth of Population, Employment and Housing Stock
- Change in Rental Vacancy Rates
- Share of Severely Crowded Households
If the population is falling and vacancy is increasing, the resulting surplus of units can depress property values and result in abandonment and a general decline in quality. In contrast, when the population is growing faster than the housing stock, overcrowding, speculation, and higher rents and sale prices may follow. Local Housing Solutions offers policy solutions to reduce barriers to new development and increase housing supply, such as zoning changes to increase residential density, streamlining of the permitting processes for development approval, and tax incentives for new construction and substantial rehabilitations.
6. Housing Stock Characteristics
A thorough understanding of the housing stock characteristics can help jurisdictions identify and anticipate housing stock needs and identify mismatches between types of housing available and the needs of the population. The Housing Needs Assessment presents:
- Age of Housing Stock
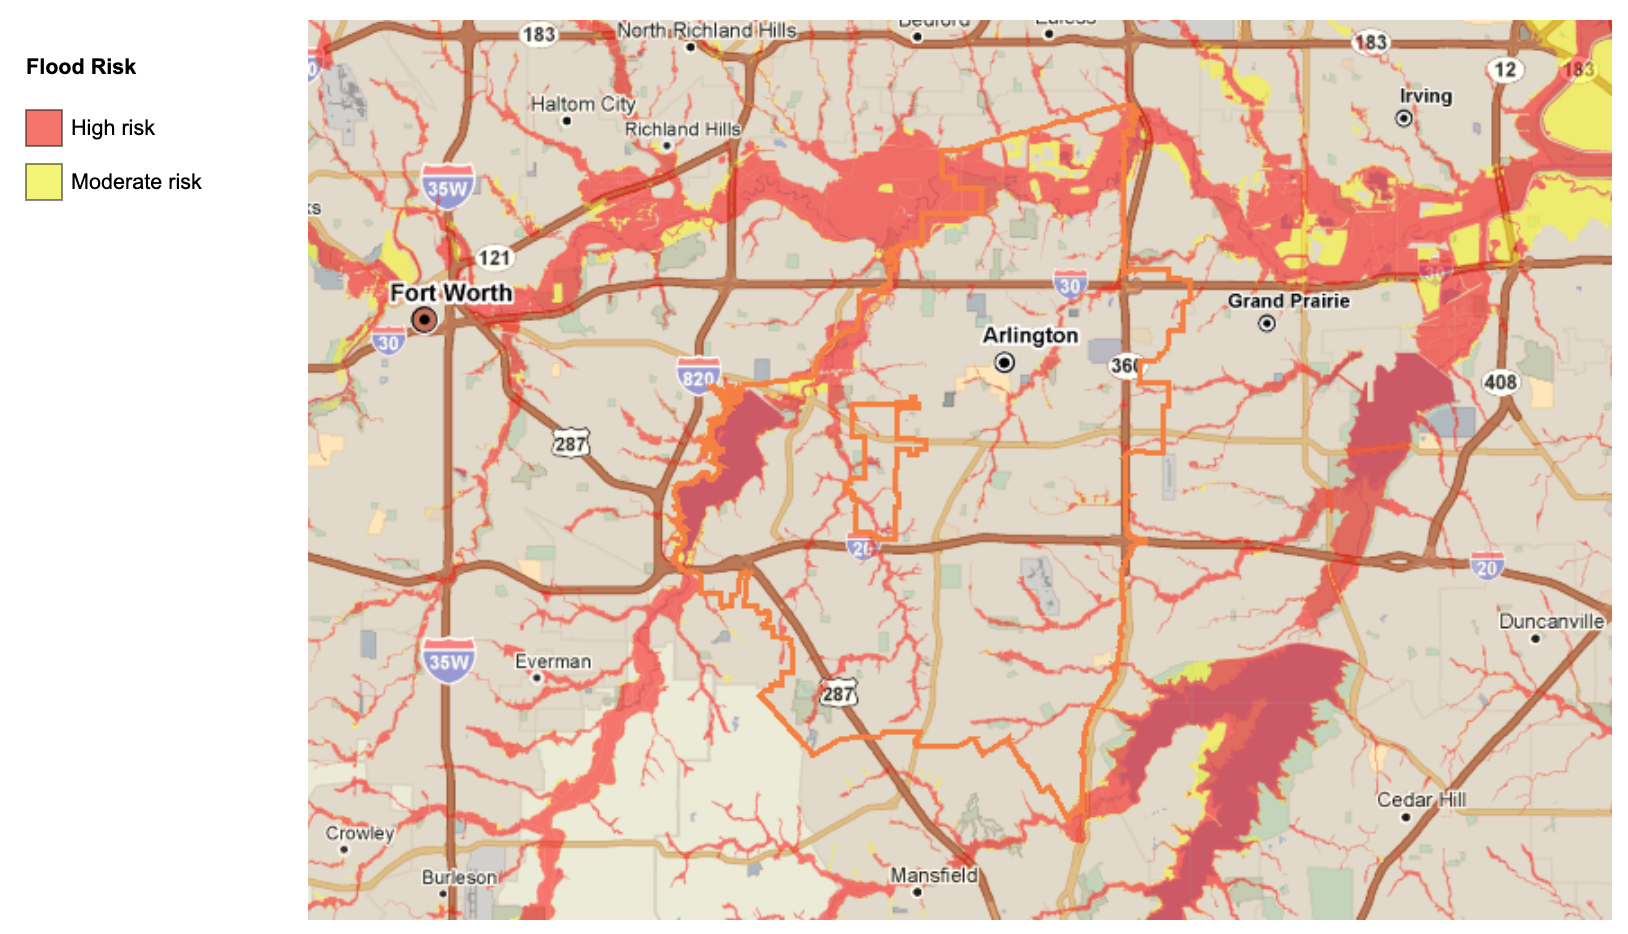
- Flood Risk
- Comparison of Counts of Small Units and One- to Two-Person Households
For example, below is a map of Arlington, TX’s flood risk. To enhance resilience to flooding and other climate-related threats, Local Housing Solutions offers these resources.
7. Neighborhood Variations
The Housing Needs Assessment presents maps at the neighborhood-level for the following attributes:
- Poverty Rate
- Race and Ethnicity
- Median Rent
- Change in Median Rent
Neighborhood-level data can illuminate patterns of poverty, segregation, and access to resources, all of which are important considerations in a comprehensive and balanced housing strategy. For example, to affirmatively further fair housing and promote racial equity, consider initiatives that increase affordable housing in resource-rich areas or boost investments in low-income neighborhoods. Learn more about affirmatively furthering fair housing or use historical data on PolicyMap to inform future fair housing strategies.
8. Housing Stock for Older Adults
The data provided in this section are designed to help jurisdictions understand the needs of older adults and the availability of small housing units that might meet their needs.
- Share of Households Headed by a Senior
- Housing Tenure by Age, 65+
- Population of Older Renters and the Supply of Smaller Rental Units
- Older Adults Living in Poverty Over Time
- Cost Burdened Senior Households
In the charts below, Pittsburgh, PA’s share of households headed by a senior has increased from 2014 to 2019.
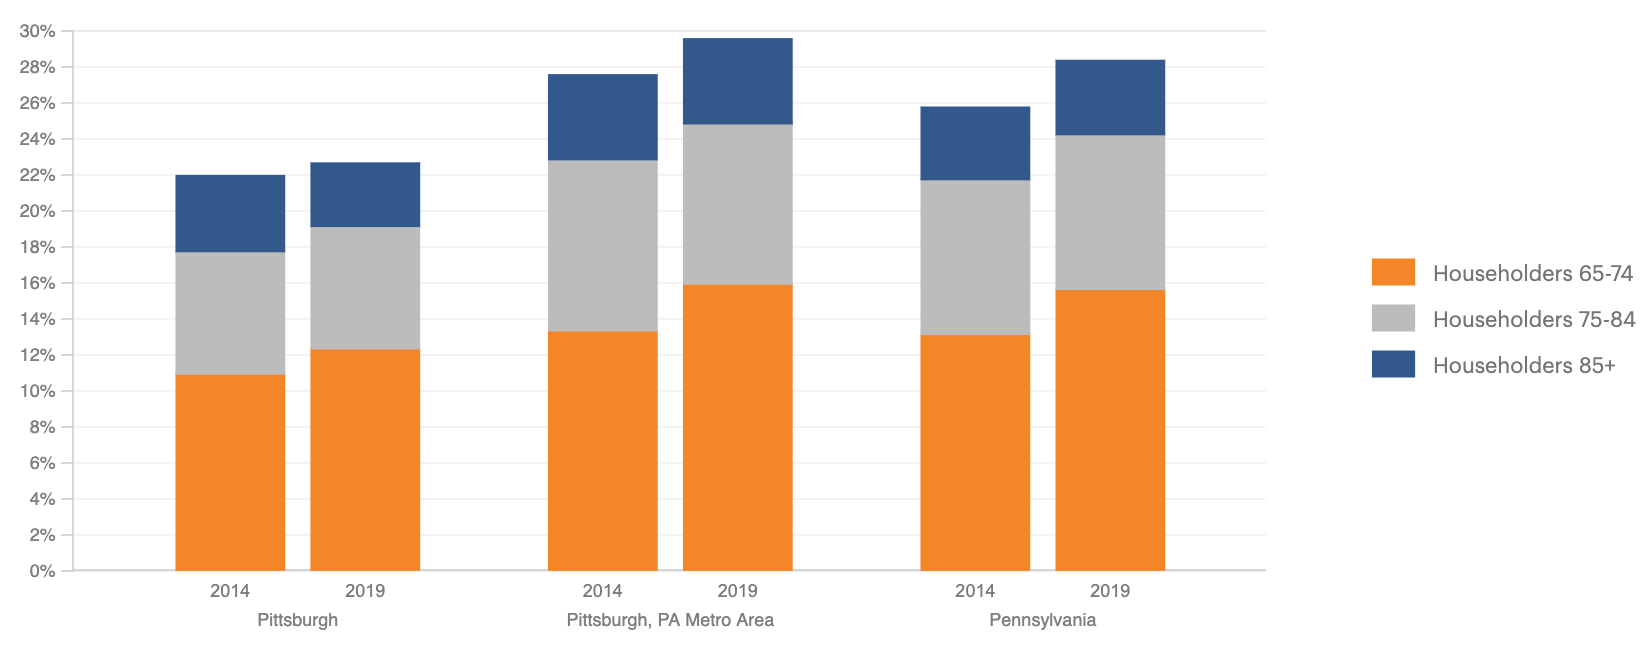
What is this growing demographic’s ability to obtain affordable housing? One indicator is to compare the number of studio and single-family units to the number of households in that particular subgroup. The chart below shows that Pittsburgh’s inventory of studio and 1-bedroom rental units grew 10.9% from 2014 to 2019, compared with the 4.2% increase in renter households headed by seniors. This data point suggests that Pittsburgh’s overall housing stock is keeping pace with the needs of the senior demographic.
PolicyMap & Local Housing Solutions are Your Partners in Developing a Housing Strategy
A Housing Needs Assessment is an early step in developing a local housing strategy. As the publicly-available tool relies on nationally available data, we encourage supplementing it with local data to paint a richer and deeper picture of your locality’s housing needs.
Interested in integrating your data with ours? Contact PolicyMap to learn more about uploading and visualizing your local data in our platform.