
Strategic Planning & Grant Application Resource for Public Libraries

The modern library is not only a repository for books but a neighborhood hub for people to gather, connect and learn. Library leaders aim to engage with community members and provide vital services that are reflective of the changing needs of their community. Great libraries make it their mission to enhance the quality of life for the entire community.
As library leaders seek to understand and meet the changing needs of the populations they serve, PolicyMap data and maps help libraries stay on top of shifting demographics, such as growing concentrations of working families or senior populations. With foundational knowledge about the communities they serve, librarians can use PolicyMap to identify problems such as the need for internet access, food insecurity, health factors and housing conditions. With the 2020 Census coming soon to PolicyMap, along with data from over 150 other sources, it’s easy to see where public libraries might best focus their efforts.
SWOT Analysis for Public Libraries
When libraries conduct a SWOT analysis (Strengths, Weaknesses, Opportunities, Threats) to identify the most critical issues facing their communities, PolicyMap can simplify the exercise with comprehensive data and an easy-to-use mapping interface.
Strengths – Pinpoint strengths such as areas with high-income households that can support the library financially. Produce a list of community non-profits, businesses and anchor institutions that can serve as partners.
Weaknesses – Find areas lacking digital access, dealing with high levels of poverty, served by lower performing schools, or lacking access to transportation.
Opportunities – Identify new ways to connect residents to library programs such as children in schools without a library or seniors who live by themselves. Identify the schools and social services that serve these populations to create new community partnerships. Identify small businesses in the area and create programs to support entrepreneurship.
Threats – Locate the threats that pose a risk to the people served by the library such as high rates of COVID-19 or other health conditions, access to health services, unemployment or declining learning levels.
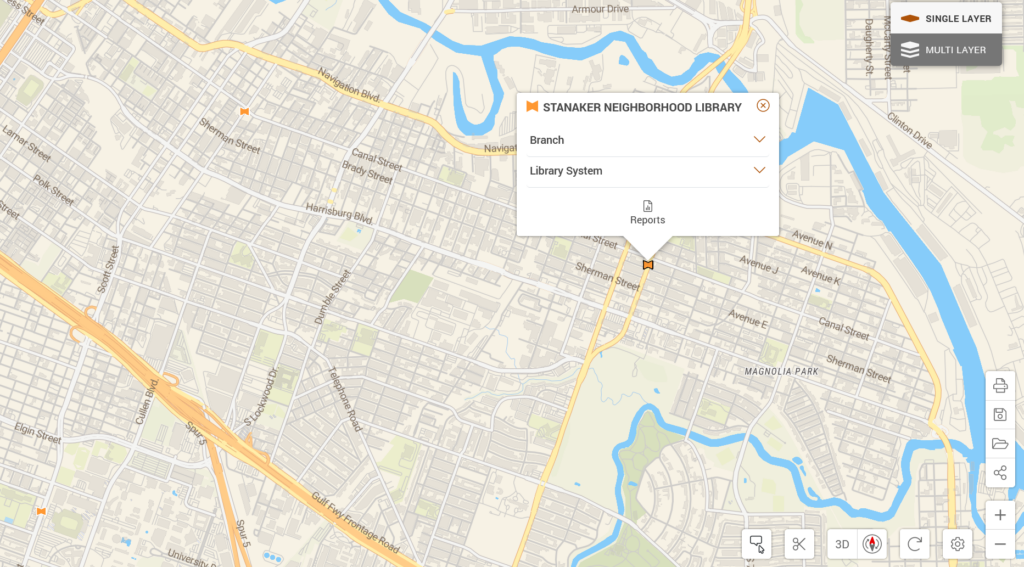
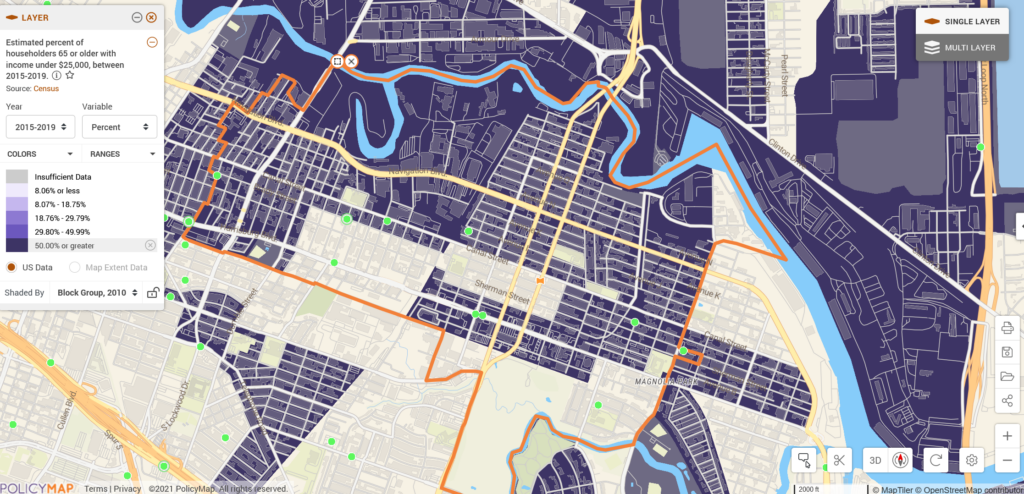
Looking at the community surrounding the Stanaker Area Library in Houston Texas, for example, library leaders can immediately see the location of the library, note that it is served by a bus line, is surrounded by a host of nonprofits with whom it could partner, and needs to serve a growing percentage of residents over the age of 65, who primarily earn less than $25,000 per year.
The location of the library:
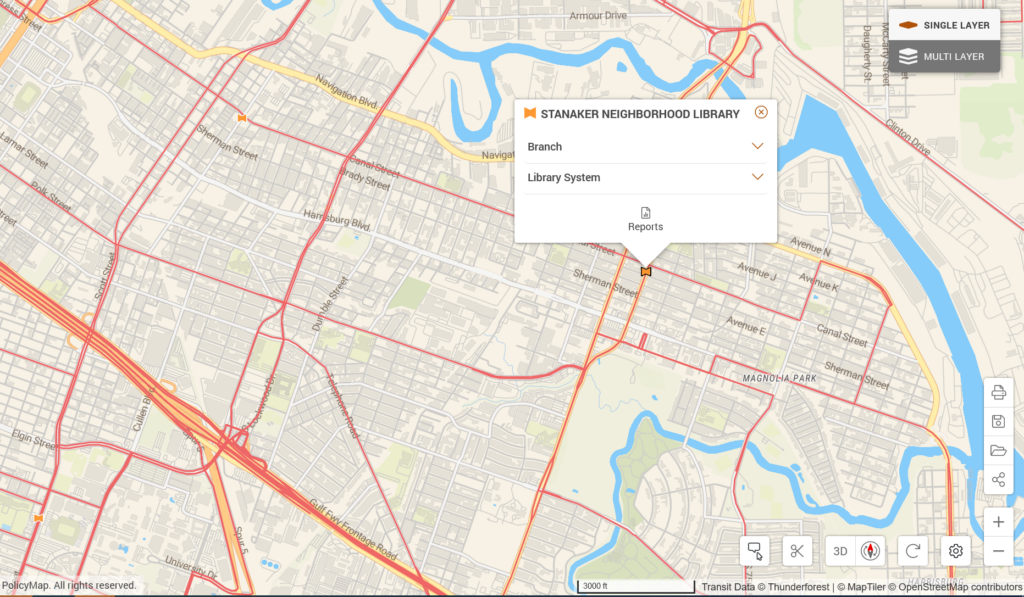
It’s proximity to a bus line, as noted by the red line:
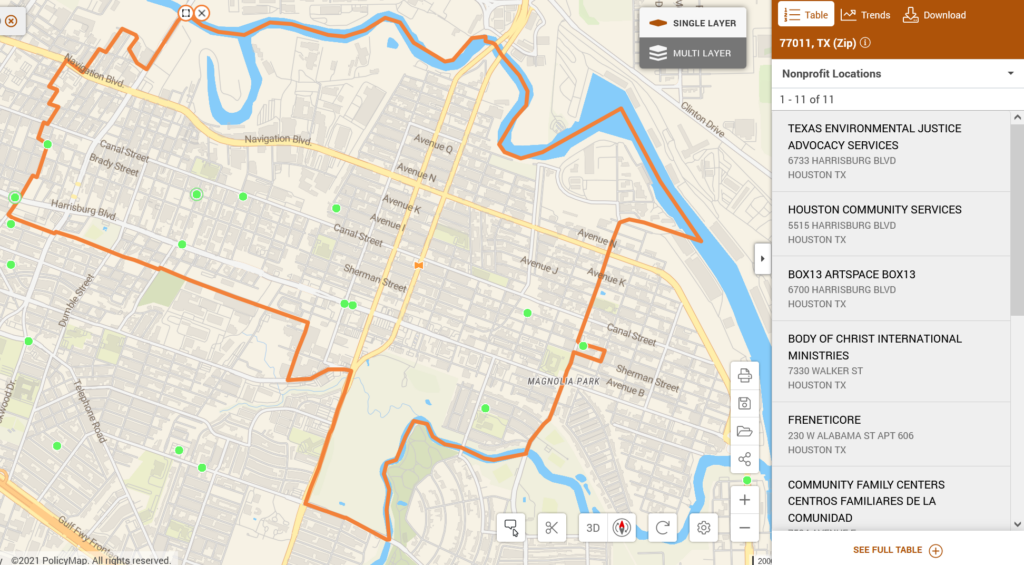
The surrounding non profits noted in green circles:
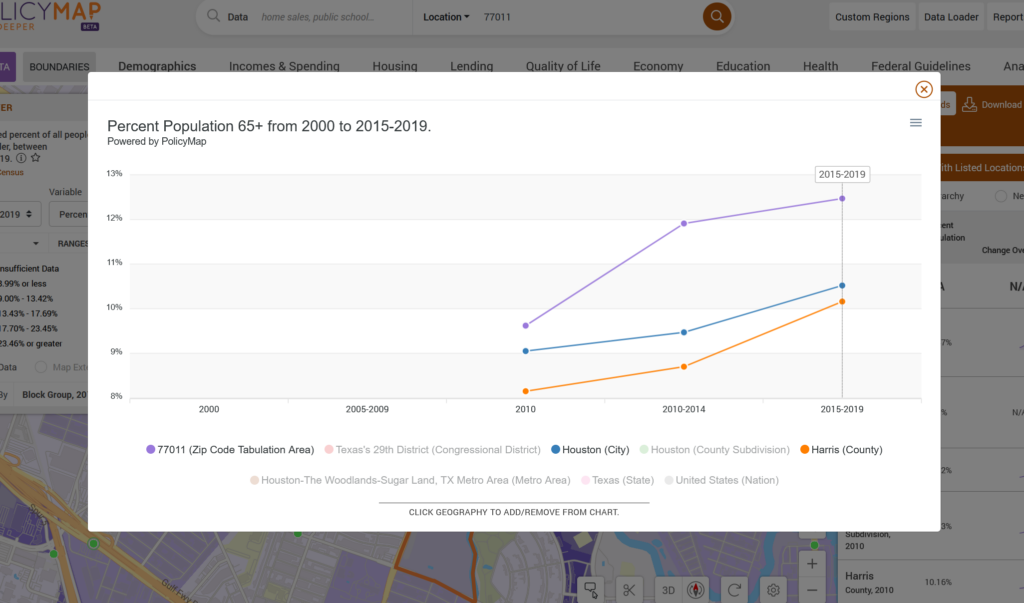
The change in population over the age of 65 in the zip code served by the library, as compared to the city and county:
The concentration of people over the age of 65 earning less than $25,000 per year as noted in the dark purple neighborhoods on the map:
More Effective Grant Writing, Community Building, and Impact Analysis
With this kind of compelling data at the ready, public libraries can pursue grant funding and stand out in a competitive grant environment. Grant types generally include project support, operating support, and capital support. These can include after-school activities, literacy programs, STEM and coding related programs, financial literacy classes, small business assistance, wifi access, new computer equipment, building renovations, and programs designed to serve specific ethnic groups and promote diversity. Good data helps libraries to clearly articulate the purpose of their proposed programs and the problems they are attempting to address.
Grant funding has enabled libraries like the Toledo Lucas County Public Library to provide career services or PolicyMap customer King County Library System to improve digital equity and improve COVID-19 response or the Philadelphia Free Library to create an early literacy program and establish a central program for senior services.
Data for Public Libraries
PolicyMap data that can help libraries with strategic planning and grant applications include:
Demographics
- Ages
- Household Types
- Racial and ethnic groups by age
- Foreign-Born Populations
- Non-English speaking people
- Diversity
Incomes and Spending
- Incomes by household size
- Low-income households
- Food Insecurity
Housing
- Home Values
- Housing Conditions
- Homeowner and Renter Cost Burdens
- Household Turnover
- Assisted Housing Locations
Lending
- Paycheck Protection Loans Business Locations
- Small Business Loans
- Small Business Loan Locations
Quality of Life
- Computer and Internet Access
- Transportation
- Environmental and Disaster Risk
- Food Access
- Libraries, Museums, Nonprofit Locations
Economy
- Residents by Occupation
- Residential and Business Vacancies
- Employment rates
Education
- School remote learning and reopening rates
- Educational Attainment
- School district statistics
- School district performance
Health
- Health Conditions including COVID-19 Risks and High Risk Populations
- Risk Factors
- Access to Medical Care
PolicyMap data and maps are an excellent resource for public library administrators for strategic planning, community engagement, grant applications, impact analysis and reference. Our mapping tool is a single source of information that allows library directors, boards, and stakeholders to streamline access to thousands of datasets.
Contact us to schedule a demo.