
Affordability Series, Part 2: Where Homes Got Furthest Out of Reach

Data
Housing – Home Sales
Source
Black Knight – Federal Housing Finance Agency (FHFA)
Find on PolicyMap
- Housing
- Home Sales
- Home Sales
Key Takeaways
- The number of ZIP codes where the median home cost more than five times local income more than doubled between 2009 and 2022, from about 1,640 to about 3,680.
- In Hawaii, California, and DC, nearly 9 in 10 ZIP codes were above 5 in 2022. More than 70% of ZIP codes in Washington, Oregon, and Colorado were too.
- The fastest growth came in states that were relatively affordable in 2009: Arizona went from 9 ZIP codes above 5 to 163, Nevada from 1 to 64, and Florida from 49 to 330.
- Smaller increases in Maine, Tennessee, and Vermont show affordability pressure spreading beyond traditionally high-cost markets. Pennsylvania was one of the few states to move the other way, from 14 to 9.
Affordability has become the defining economic issue of this midterm election cycle, and for good reason. Gas, groceries, health insurance and housing are all rising faster than paychecks, and the squeeze is landing hardest on younger households. As The New York Times recently reported, Americans in their early 30s, now the largest age group in the country, feel they can’t afford a home, a baby, or much of anything else, and their frustration is reshaping cities and their politics. The housing numbers back them up: first-time buyers now make up just one in five home purchases, a record low. But the squeeze isn’t the same everywhere, and the solutions won’t be either. Knowing exactly where home prices have pulled furthest from local incomes is the first step toward the right strategies in the right places. In this post, Claude, connected to PolicyMap’s MCP server, maps that gap ZIP code by ZIP code. The harder question is what we, as people, do with what it shows.
A note on the article below: This analysis was written by Claude, Anthropic’s AI model, using PolicyMap’s soon-to-be-released MCP server. Insights like these will be available to PolicyMap customers shortly, when they connect Claude or other AI tools to PolicyMap. Faster, deeper insights using PolicyMap’s trusted data in the space where you are already working. The ease of AI, grounded in data you can defend.
Dig Deeper: Home Prices and Incomes
Nationally, the median existing single-family home sold for 3.6 times the median household income in 2009. By 2022 that ratio had reached 5.0, and in 2025 it stood at 4.7, according to Harvard’s Joint Center for Housing Studies. All three readings sit above the ratio of about 3 long considered affordable.
That national number hides enormous local variation. Using PolicyMap’s ZIP code data, we looked at where home prices pulled furthest away from local incomes between 2009 and 2022.
ABOUT THE DATA
Price-to-Income Ratios by ZIP Code
The home sale price to income ratio is a new indicator created by PolicyMap as part of our focus on Affordability in America. It pairs Black Knight home sales data with IRS income data at the ZIP code level, and joins the growing set of cost-of-living measures in PolicyMap’s Affordability Series, which brings housing, transportation, childcare, food, and healthcare cost data together in one place. Earlier in the series, we introduced the Income Distribution Index, which shows whether an area skews lower, moderate, or higher income.
Where homes cost more than five years of income
The number of ZIP codes where the median home cost more than five times local income more than doubled between 2009 and 2022, from about 1,640 to about 3,680. While 3 times local income has traditionally been considered affordable, five is roughly the national ratio for 2022. These are places where homes were even further out of reach than the country as a whole.
IRS ZIP code income data currently runs through 2022, so this analysis ends there. As soon as more recent years are available, we will update this post and add them. Certainly, from all that we are reading regarding the inability of buyers to purchase a home in this market, we will see the ratios rise with more recent data.
Our ZIP code ratio divides the median single-family sale price by the average adjusted gross income (AGI) reported on IRS tax returns in the same ZIP code. We counted only ZIP codes with at least 20 single-family sales in the year measured.
The 41 states plus DC with meaningful ZIP code coverage, sorted by the share of ZIP codes above 5 in 2022, are as follows:
| State | ZIP codes above 5 (2022) | Share of state’s ZIP codes (2022) | ZIP codes above 5 (2009) | Highest ZIP code ratio (2022) |
|---|---|---|---|---|
| Hawaii | 52 | 90% | 41 | 21.3 |
| California | 1,119 | 89% | 707 | 28.2 |
| District of Columbia | 15 | 88% | 14 | 9.9 |
| Washington | 284 | 78% | 77 | 10.4 |
| Oregon | 185 | 76% | 53 | 9.7 |
| Colorado | 227 | 71% | 34 | 16.4 |
| Arizona | 163 | 59% | 9 | 8.8 |
| Nevada | 64 | 57% | 1 | 8.8 |
| Massachusetts | 197 | 47% | 90 | 18.7 |
| Rhode Island | 25 | 43% | 2 | 7.5 |
| Florida | 330 | 38% | 49 | 13.6 |
| Maryland | 110 | 35% | 54 | 11.5 |
| Delaware | 14 | 29% | 1 | 6.8 |
| New Jersey | 147 | 28% | 118 | 14.8 |
| Vermont | 25 | 22% | 1 | 9.1 |
| New York | 211 | 22% | 203 | 31.1 |
| Virginia | 98 | 21% | 56 | 10.9 |
| Maine | 33 | 17% | 1 | 8.8 |
| North Carolina | 93 | 16% | 29 | 7.5 |
| Georgia | 77 | 15% | 12 | 9.0 |
| South Carolina | 35 | 14% | 17 | 6.8 |
| New Hampshire | 22 | 13% | 3 | 7.1 |
| Connecticut | 20 | 9% | 12 | 7.6 |
| Tennessee | 42 | 9% | 1 | 11.7 |
| Minnesota | 22 | 6% | 2 | 8.6 |
| Illinois | 35 | 6% | 28 | 11.9 |
| Indiana | 1 | 2% | 0 | 5.2 |
| Louisiana | 4 | 2% | 0 | 5.7 |
| Alabama | 4 | 1% | 2 | 7.7 |
| Oklahoma | 3 | 1% | 1 | 12.1 |
| Pennsylvania | 9 | 1% | 14 | 6.2 |
| Ohio | 6 | <1% | 2 | 5.8 |
| Wisconsin | 3 | <1% | 3 | 5.6 |
| Michigan | 3 | <1% | 0 | 5.3 |
| Kentucky | 1 | <1% | 0 | 5.0 |
| Arkansas | 0 | 0% | 0 | — |
| Iowa | 0 | 0% | 0 | — |
| Missouri | 0 | 0% | 1 | — |
| Nebraska | 0 | 0% | 0 | — |
| North Dakota | 0 | 0% | 0 | — |
| South Dakota | 0 | 0% | 0 | — |
| West Virginia | 0 | 0% | 0 | — |
Almost all ZIP codes in Hawaii, California, and DC were above 5 in 2022, along with more than 70% in Washington, Oregon, and Colorado.
The fastest spread came in places that were affordable in 2009. Arizona went from 9 ZIP codes above 5 to 163, Nevada from 1 to 64, and Florida from 49 to 330. Smaller jumps in Maine (1 to 33), Tennessee (1 to 42), and Vermont (1 to 25) show the pressure reaching beyond the usual high-cost markets. Pennsylvania was one of the few states to move the other way, from 14 to 9.
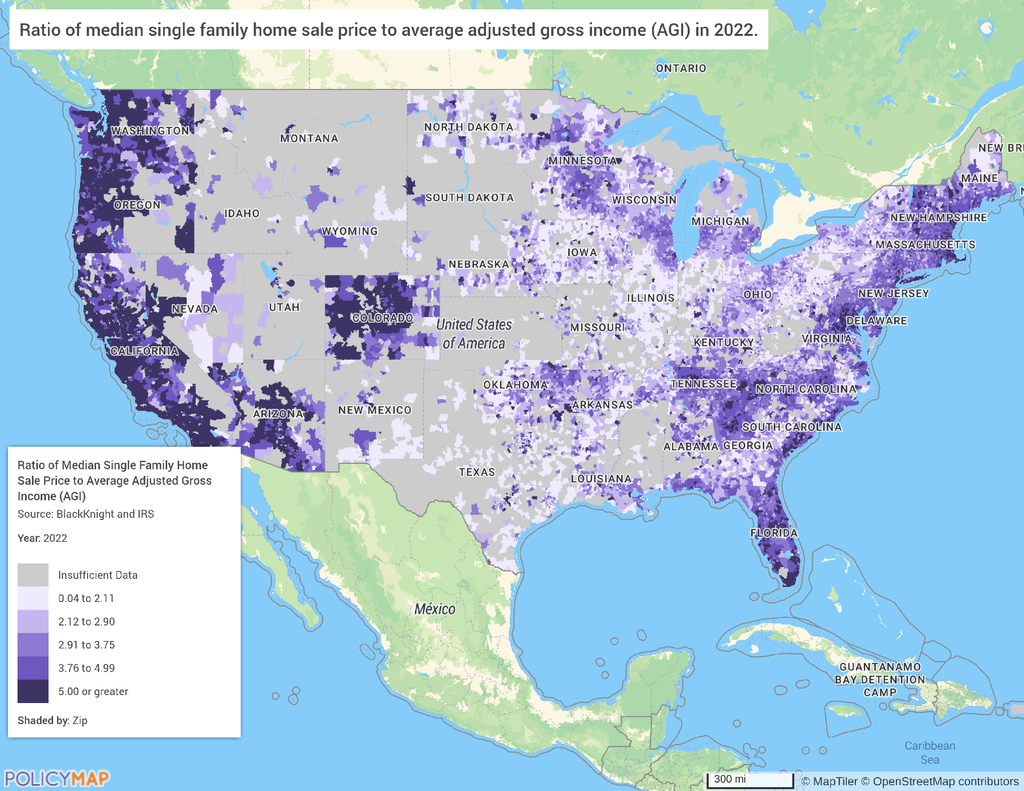
Notes on coverage: Sales data is thin in states where sale prices are not public record, so nine states are left out of the table.
- No ZIP codes with enough sales to measure (20 or more in 2022): Alaska, Idaho, Montana, Utah and Wyoming.
- One to five ZIP codes with enough sales: Mississippi (1), Texas (2), Kansas (3) and New Mexico (5). Too few to represent the state; one of New Mexico’s five was above 5.
About the data
The ZIP code ratio divides the median single-family sale price (Black Knight) by the average adjusted gross income (AGI) per tax return from IRS Statistics of Income ZIP code data, both via PolicyMap.
- We counted only ZIP codes with at least 20 single-family sales in the year measured. ZIP codes that straddle a state line can appear in both states, so state counts add up to slightly more than the national total.
- The national figures from Harvard JCHS use median household income, while our ZIP code ratio uses average AGI. The two are not directly comparable as a result, but we can compare their direction and size of change.
- Average AGI is pulled upward by high earners, which tends to lower the ratio in affluent areas. Changes in the ratio are more reliable than its level.
- In 2009, many zip codes were still dominated by foreclosure and distressed sales, which depressed starting prices and amplified later increases.
You can explore this zip code-level data in your community by logging into PolicyMap and searching under our Housing menu.
Sources: Black Knight and IRS Statistics of Income via PolicyMap; national ratios from Joint Center for Housing Studies of Harvard University, The State of the Nation’s Housing 2026, Appendix Table W-16.
Request More Information
PolicyMap’s home sale price to income ratio is available for ZIP codes across the country, alongside housing, transportation, childcare, food, and healthcare cost data in our Affordability Series. Contact us to learn more about this data or our forthcoming MCP server.