
Publish Dashboards
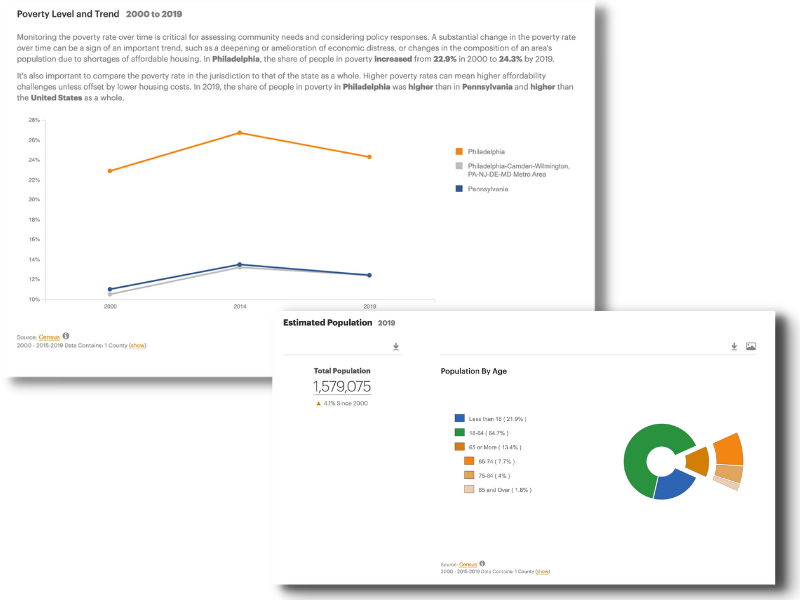
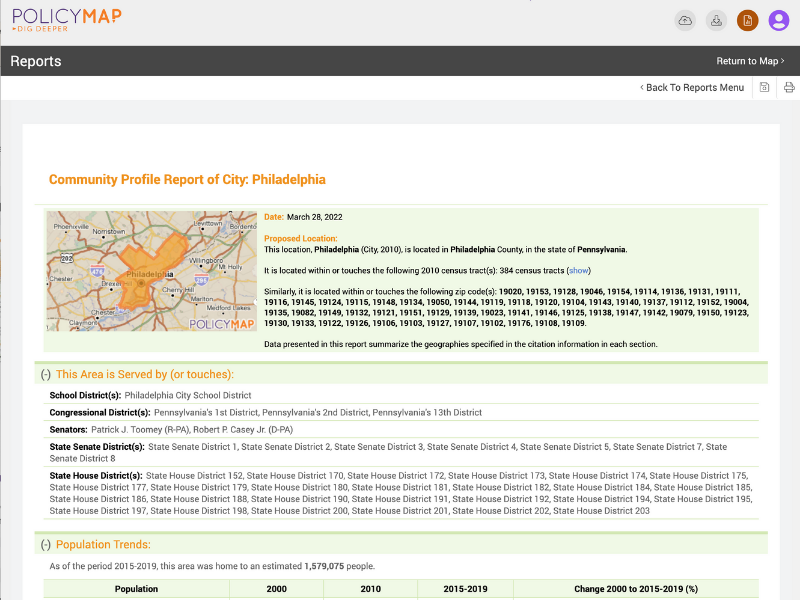
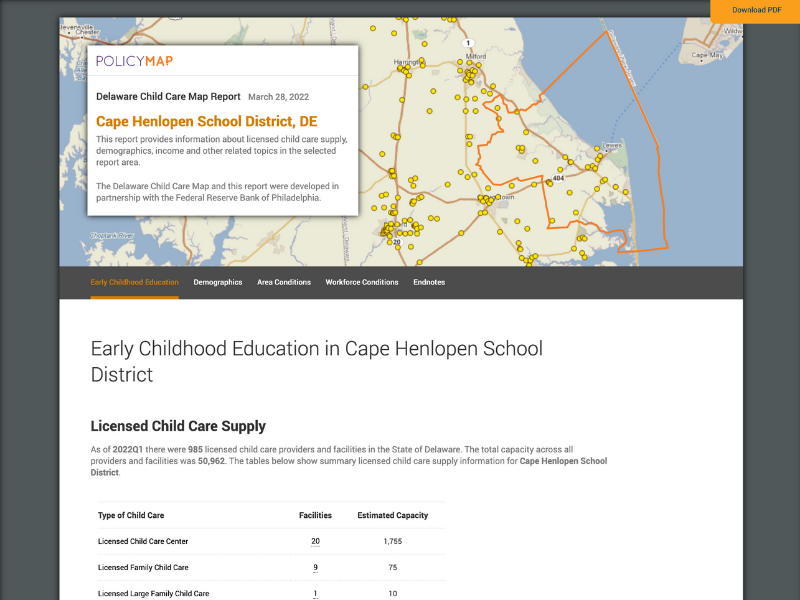
Understand more about your data. Uncover more meaningful answers. Inspire others to dig deeper and take action. PolicyMap subscribers can instantly run community profiles, health reports, housing reports, and mortgage reports for a community or a custom area.
Inform With A Glance
Dashboards are essential reporting tools. They communicate critical information to staff, stakeholders, and sometimes your community. PolicyMap dashboards and reports enable users to transform place-based data into intuitive and interactive visualizations.
Answer Deep Questions With Data
Maps are great visualization tools. They allow you to see what life is like in a neighborhood and explore communities. Dashboards help you dig deeper into your data, offering faster, more meaningful answers.
Simplify And Accelerate Decision Making
Alongside our maps, dashboards help identify key data points and present compelling and interactive visualizations. They simplify interpreting and integrating data so you and your team can develop powerful, comprehensive strategies.
Let’s Talk Dashboards.
Interested in using dashboard to engage staff, stakeholders, and community members? Share a bit about yourself below and we’ll be in touch.

Community Profile
Get up-to-date information on population, racial composition, age, income and workforce.

Community Health Report
Get information about the health, demographics and conditions of a community. Currently available for counties and census tracts.

Rental Housing Report
Get rents by bedroom size, income and affordability data.

Home Mortgage Report
Get a summary of the number, typical amount, and type of home mortgages originated, including high-cost lending activity and high interest loans by race.
Custom Dashboards
Work with our Analysis & Insights Service team to generate custom reports and dashboards for your staff, stakeholders, or community.