
Dashboards & Reports
ANY PLACE. ANY BOUNDARY. ONE REPORT.
Dashboards Built Around Your Geography
Pull a full report for any geography, including the ones you define. Draw a service area or a radius around a location, or combine neighborhoods, and PolicyMap does the calculations for you. Get demographic, housing, health, and economic data for that exact area in minutes.
Customize what you see by choosing sections, reordering content, and switching between charts, tables, and other visuals. Add AI-generated summaries to highlight key takeaways and make your findings easier to understand. Export full reports or individual sections as PDFs, images, or data files, ready to share or use in your workflow.
View Sample PolicyMap Dashboards
COMMUNITY PROFILE
Florida 24th Congressional District
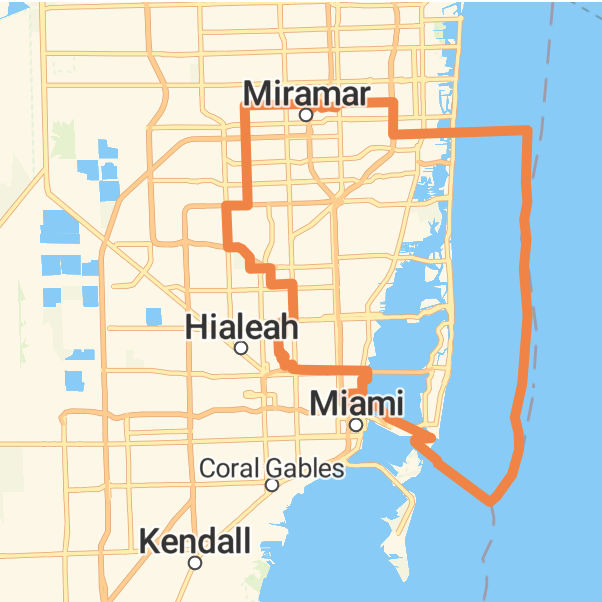
A full community profile for a congressional district, a geography many data tools don’t support.
POPULATION HEALTH
Topeka Hospital Service Area
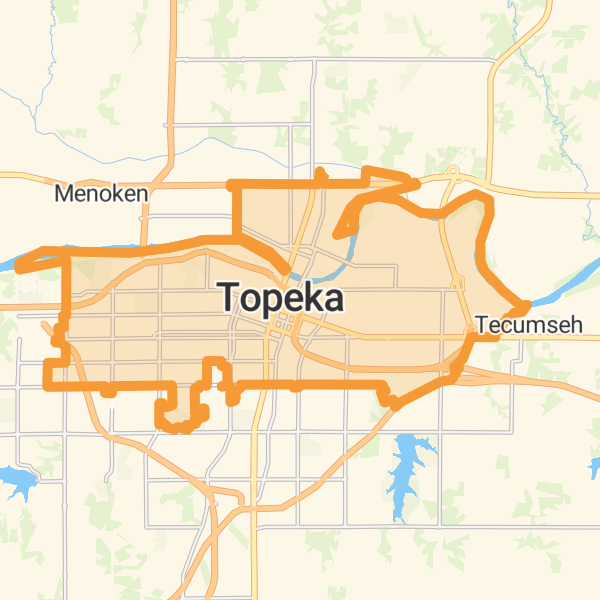
(Custom region) Population health data for a hospital’s service area, calculated from a collection of zip codes.
COMMUNITY PROFILE
Lincoln, Nebraska Public School District
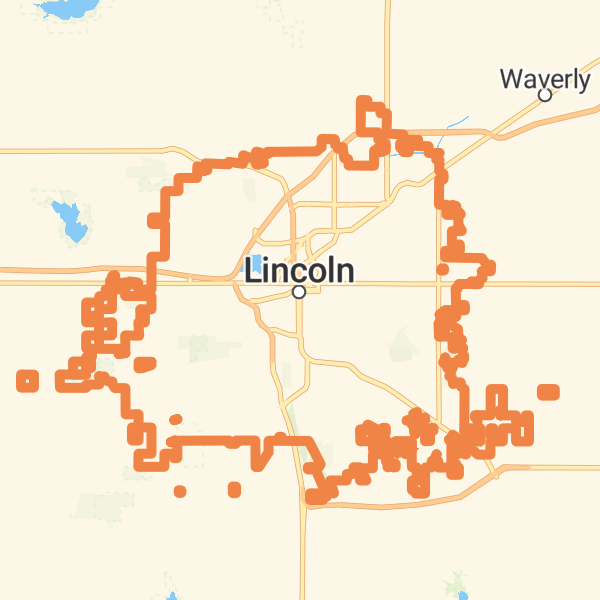
Demographic and economic data for a school district.
POPULATION HEALTH
Baltimore Hospital Service Area
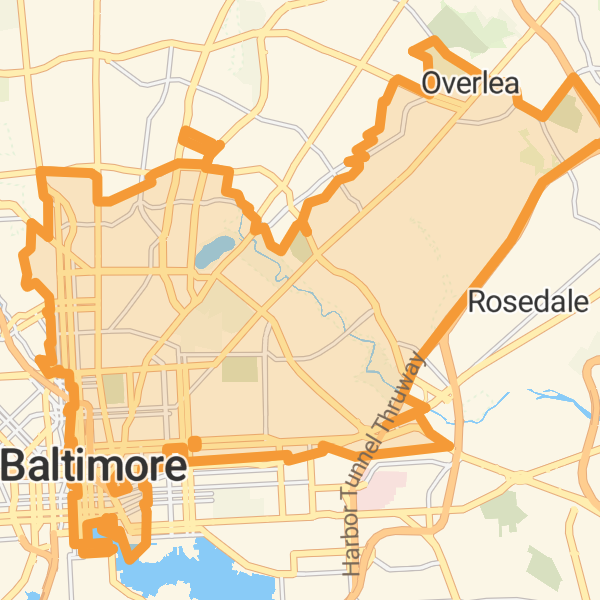
(Custom region) Population health indicators for a custom service area assembled from multiple zip codes.
Need Something More Specific?
Beyond our Community Profile and Population Health dashboards, we build custom dashboards and reports around your indicators, your geographies, and your audience. Tell us what you need to track, and we’ll design it with you. Fill in the form below to get in touch.