
Investing in Communities: Understanding Trends and Needs

Data
County-to-County Migration Data Files
Source
IRS Statistics of Income Division
Find on PolicyMap
- Demographics
- Race, Ethnicity, Diversity
- Race, Ethnicity, Diversity
The passage of the Inflation Reduction Act (IRA) marks a significant step towards addressing pressing issues like carbon emissions reduction, energy innovation, and support for underserved communities across the United States. With the IRA in place, the EPA has gained the authority to execute a $27 billion investment strategy aimed at leveraging financing and private capital to confront the climate emergency. Through the Greenhouse Gas Reduction Fund, communities, especially those marginalized in the past, can anticipate not only reduced energy expenses but also economic revitalization. However, comprehending the market and housing dynamics in these regions is essential to tailor interventions that effectively address local needs.
One key criterion for identifying these communities revolves around their vulnerability to climate change and socio-economic status. Census tracts meeting specific thresholds for climate-related risks and low-income levels are prioritized for investment. But beyond these metrics, delving into broader population trends and housing characteristics is essential for tailoring interventions.
Population Dynamics and Migration Data
Domestic migration patterns offer valuable insights into the demographic shifts occurring within different regions. While census data helps identify areas experiencing growth, migration data, such as that provided by the IRS, provides a deeper understanding of where US taxpayers are moving and their economic status.
Analysis of this migration data for 2020 reveals notable trends. Florida, Texas, and Arizona have the counties with some of the highest rates of net migration. These counties attract new residents with varying income levels, indicating diverse socio-economic landscapes.
| County | Net Migration | Average Income of New Households | % of Households that are New |
|---|---|---|---|
| Maricopa, AZ | 13,715 | $92,194 | 5.82% |
| Lee, FL | 13,229 | $112,512 | 10.82% |
| Collin, TX | 11,385 | $95,656 | 11.94% |
| Polk, FL | 11,216 | $52,069 | 10.66% |
| Williamson, TX | 10,713 | $88,796 | 13.26% |
Digging Deeper: Polk County, FL
Polk County serves as a compelling case study, particularly due to its concentration of disadvantaged areas and the fact that over 40% of its population lives in one of these areas. Population in these areas has increased by 13% over the last 5 years. And the influx of new households has brought lower average incomes than in other top counties, as reported by the IRS.
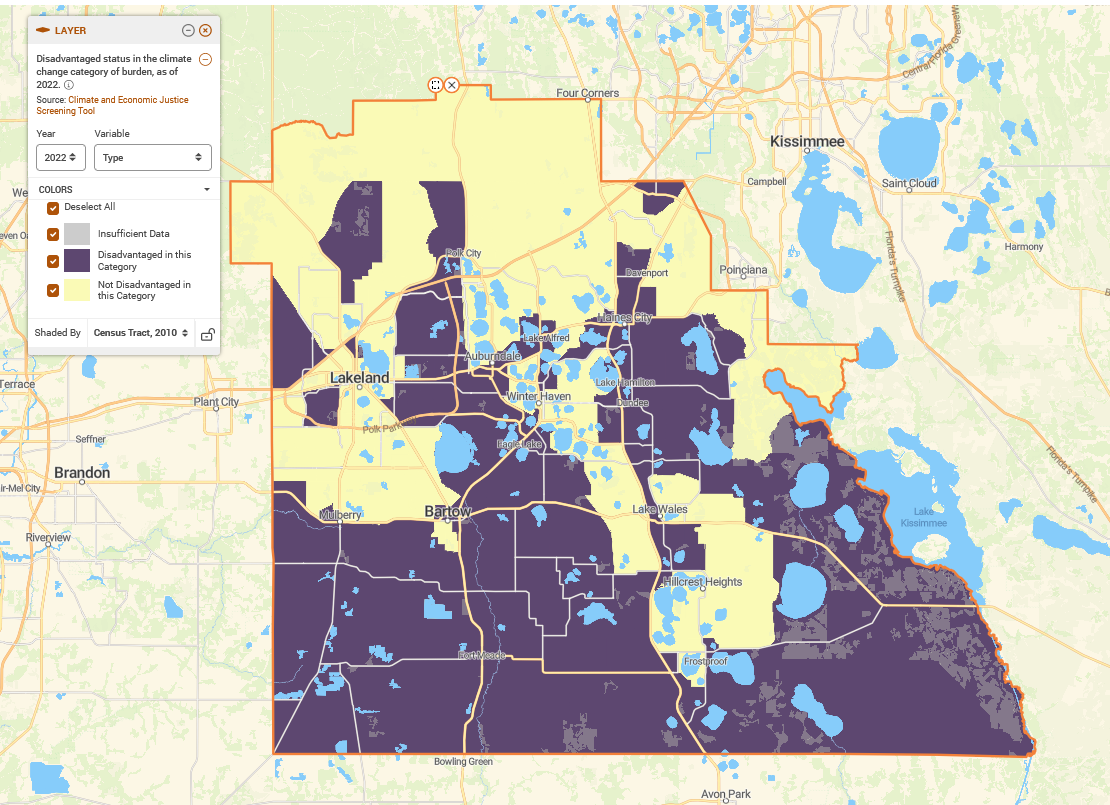
A closer examination of housing statistics sheds further light on the community’s dynamics. The predominance of single-family homes, small apartment buildings, and mobile homes underscores the diversity of housing stock. However, some of the highest rates of mobile homes are located in disadvantaged areas, a factor directly impacting their vulnerability to climate events.
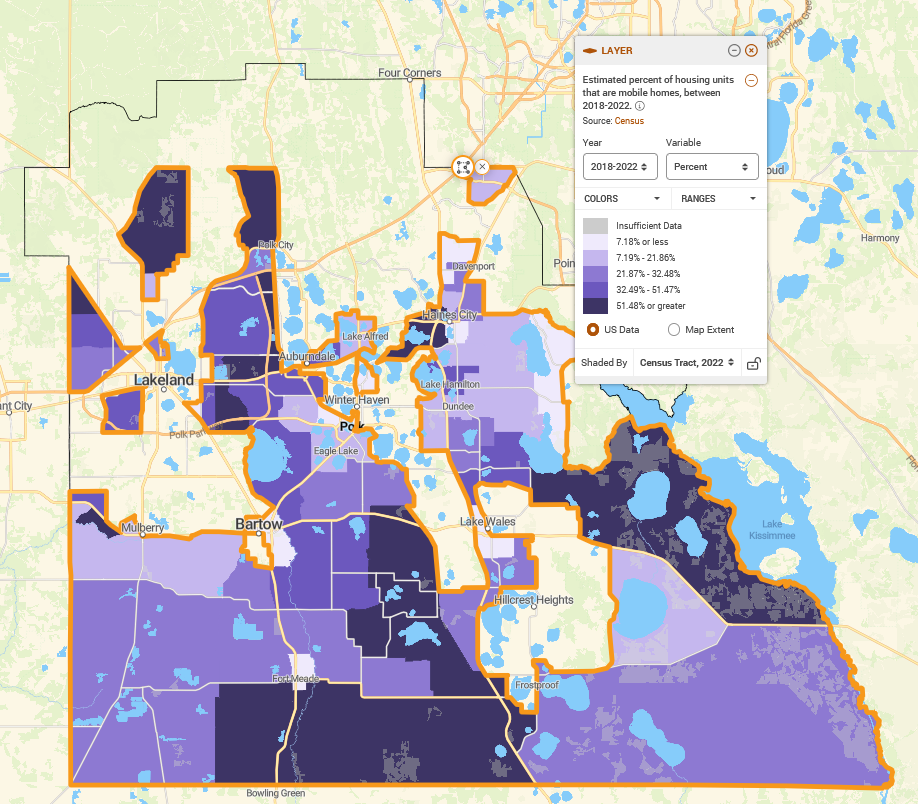
Moreover, the correlation between high mobile home rates and elderly populations in the County underscores specific demographic challenges. Addressing the needs of these communities necessitates tailored approaches that account for both population growth and housing vulnerabilities.
Tailoring Interventions
Crafting interventions for communities like those in Polk County requires a clear understanding of their unique challenges. Unlike areas experiencing population decline, where revitalization efforts may take precedence, growing communities demand proactive measures to accommodate newcomers sustainably.
Incorporating climate resilience into housing infrastructure becomes essential, especially for mobile home residents facing heightened risks. Additionally, initiatives catering to the needs of aging populations must be prioritized, considering their susceptibility to climate-related hazards.
As the IRA paves the way for targeted investments in clean energy and community development, understanding the intricacies of recipient communities is indispensable. With PolicyMap, organizations can quickly identify areas eligible for grant funding under initiatives like the Greenhouse Gas Reduction Fund. By leveraging migration data, housing statistics, and demographic trends, stakeholders can design interventions that not only mitigate climate risks but also foster inclusive growth.
Request More Information
Are you interested in learning more about PolicyMap’s migration data from the IRS and disadvantaged community locations from CEJST? Kindly provide your details below and we’ll follow up with more information.